🚀Exciting Product Updates: Smarter Error Alerts, Infra Improvements & More!
Read all updates for more details.
We’re excited to share some powerful new updates across our platform to help you monitor, debug, and optimize your systems more efficiently.
🔔 Error Tracking Alerts
You can now set up alerts for both frontend (browser, website) and backend errors in your applications. Get instantly notified with detailed error information so your team can take action faster and reduce downtime.
👉 Set up alerts now
🚀 Infrastructure Monitoring Enhancements
We've rolled out several improvements to give you deeper visibility into your infrastructure:
Enhanced listings for hosts and Kubernetes resources like Deployments, ReplicaSets, Jobs, CronJobs, DaemonSets, and StatefulSets—now with more actionable insights.
Revamped Kubernetes deployment view with:
New metrics and cluster maps
Detailed event and pod-level data
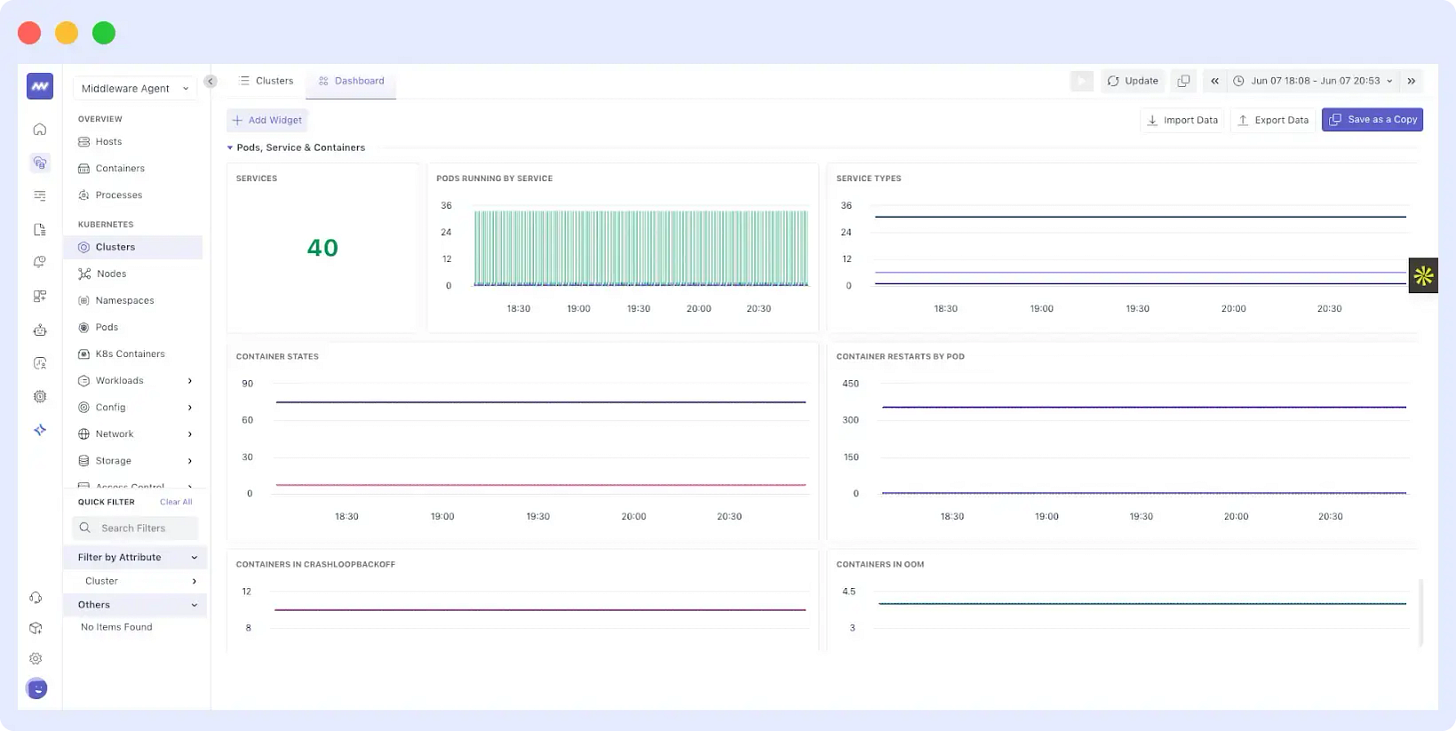
Brand-new cluster overview dashboard with a modern design and richer context.
👉 Explore the new dashboard
⚡ Performance & Usability Improvements
Optimized frontend for faster dashboard and UI load times
Added multi-select option to easily enable/disable metric collection from Settings → Pipeline → Metrics
Upgraded Windows agent to support a wider range of Windows versions for metric collection
We're committed to making your experience better with every update. As always, your feedback helps shape what we build next.


