Exciting Updates and New Features in June 2023!
Introducing database integrations and default dashboard and many more features!
I wanted to share some exciting updates and new features recently introduced to our platform.
Here are the highlights for the month of June 2023:
Vercel <> Middleware Partnership:
We are thrilled to announce our partnership with Vercel as an observability partner. You can now find us on the Vercel marketplace, where we offer a comprehensive monitoring solution for your Vercel serverless functions and performance.
For more information on how you can leverage this integration, please read the detailed guide provided.
PostgreSQL Database Integration:
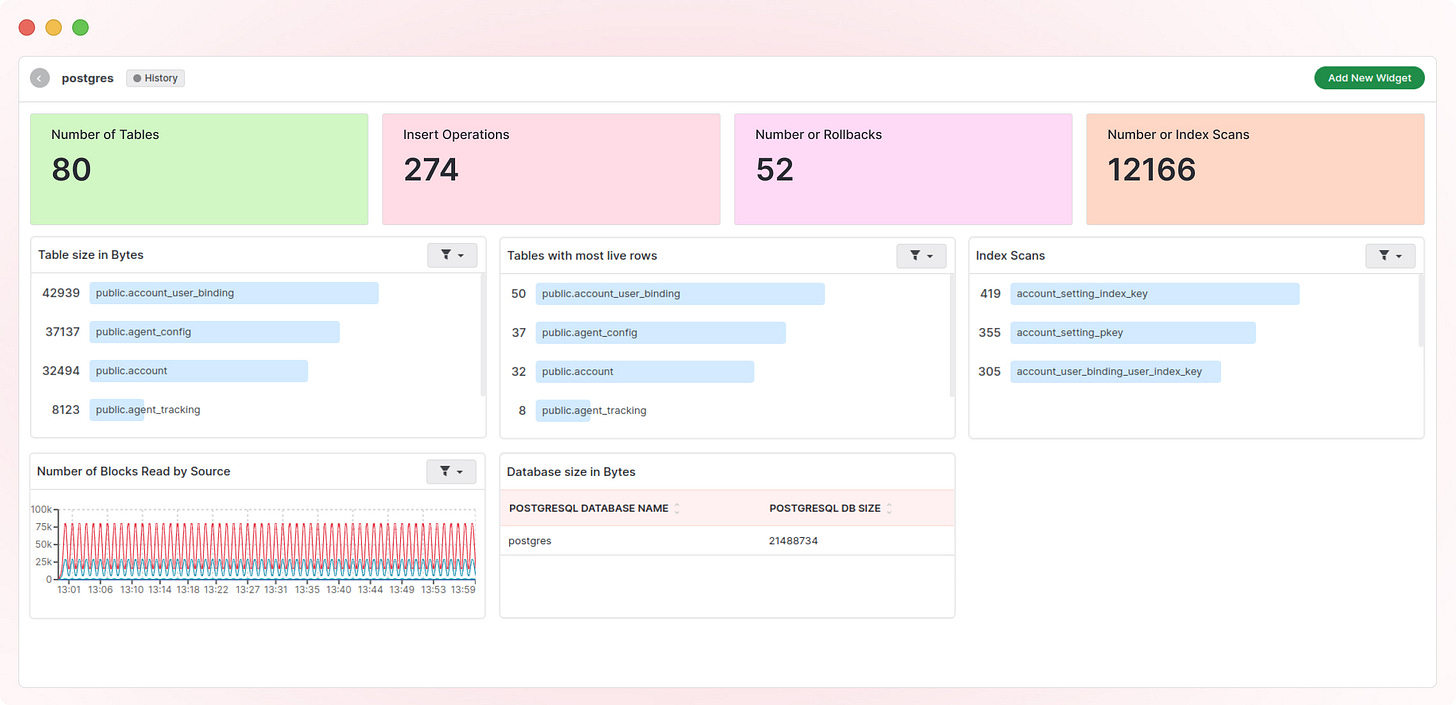
We have introduced a new feature that allows you to collect performance and health metrics for your PostgreSQL Database. These metrics can be visualized within Middleware, enabling you to understand the behavior of your database resource usage over time and track other key metrics.
Additionally, you can set up alerts to monitor any unusual performance of the database. The integration process for the PostgreSQL database is simple and straightforward.AWS Cloudwatch Metrics Reports:
To make monitoring AWS CloudWatch metrics more convenient, we have created default reports that provide you with a pre-configured dashboard. This eliminates the need for you to create a dashboard from scratch. With our default dashboard, you can effortlessly keep an eye on all the important metrics in one place.
Read here to get more detailed updates!
Here are some great improvements from our Team:
Java Application Log Support: We now support application logs in Java applications. You can access logs for Java-based applications directly on our unified dashboard and within the log module.
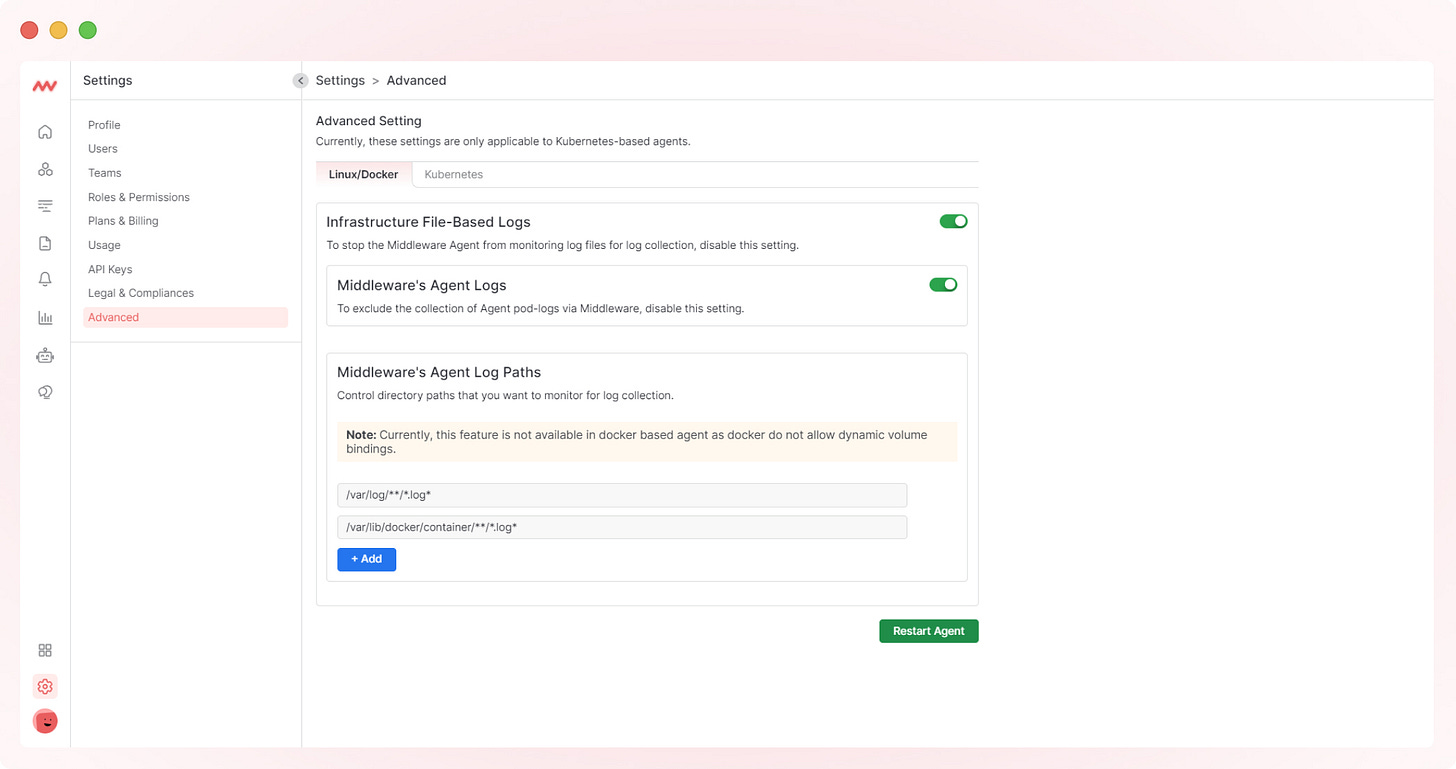
Log Customization with Advanced Settings: To give you more control over log collection, we have introduced advanced settings. You can now specify which logs to monitor and even define custom log paths.
Custom Dashboard with K8s Service Data: We have enhanced our platform to allow you to list and monitor K8s services in real time. By linking K8s pods and service data, you can create graphs that illustrate CPU, RAM, Disk, Network usage, and other parameters.
UX Update:
In response to user feedback, we have added a "save filter" option. This feature enables you to save any filter and apply it with a single click to view log data, saving you time and effort.
We believe these updates and new features will significantly enhance your experience with our platform. Try all these features for free.
If you have any questions or need further assistance, please don't hesitate to reach out to our support team at hello@middleware.io.
Thank you for your continued support!


