Expanding our database integrations with Middleware
Explore Clickhouse, Cassandra and RedPanda Integration!
A key aspect of monitoring your application is also understanding your database. To cover many modern applications today, we're expanding our database support to include ClickHouse, Cassandra, and RedPanda integrations.
Clickhouse Integration
The integration collects metadata about the database, performance heuristics for queries, and monitors the overall health of the database.
Our default Clickhouse Dashboard includes the following items, and additional metrics are available through our dashboard builder if needed:
Active Queries: Get the current query workload and optimize processing efficiency.
Merges: Monitor ongoing background merges to improve database performance.
Memory: Track memory usage to ensure system stability.
Network Activity: Track threads managing network data.
Cassandra Integration
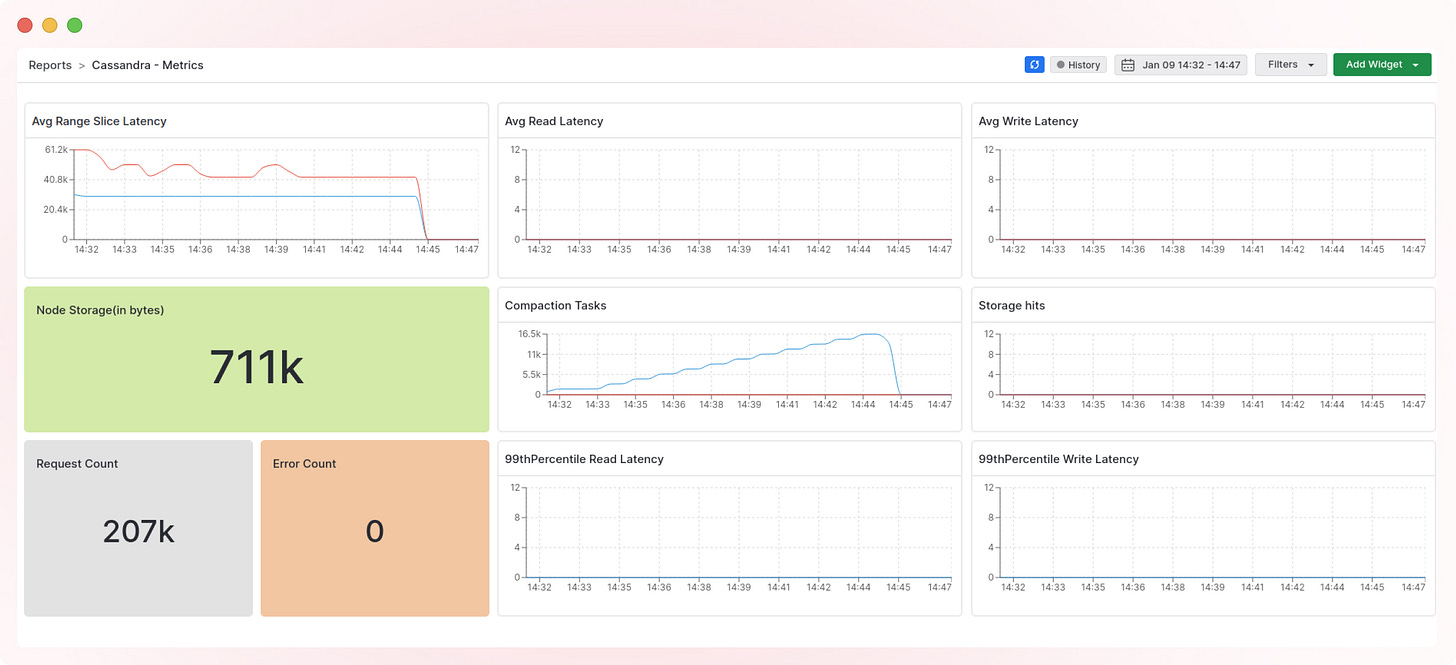
Get real-time metrics from Cassandra to visualize and monitor states and receive notifications about failovers and events.
Our integration includes the below metrics by default:
Caching Info: Monitor metrics like cache requests, latency and capacity
Buffer Pool: Helps to maintain the optimal buffer pool size.
Resource Usage: Monitor resource-based metrics such as CPU, memory, network, disk information, etc.
RedPanda Integration
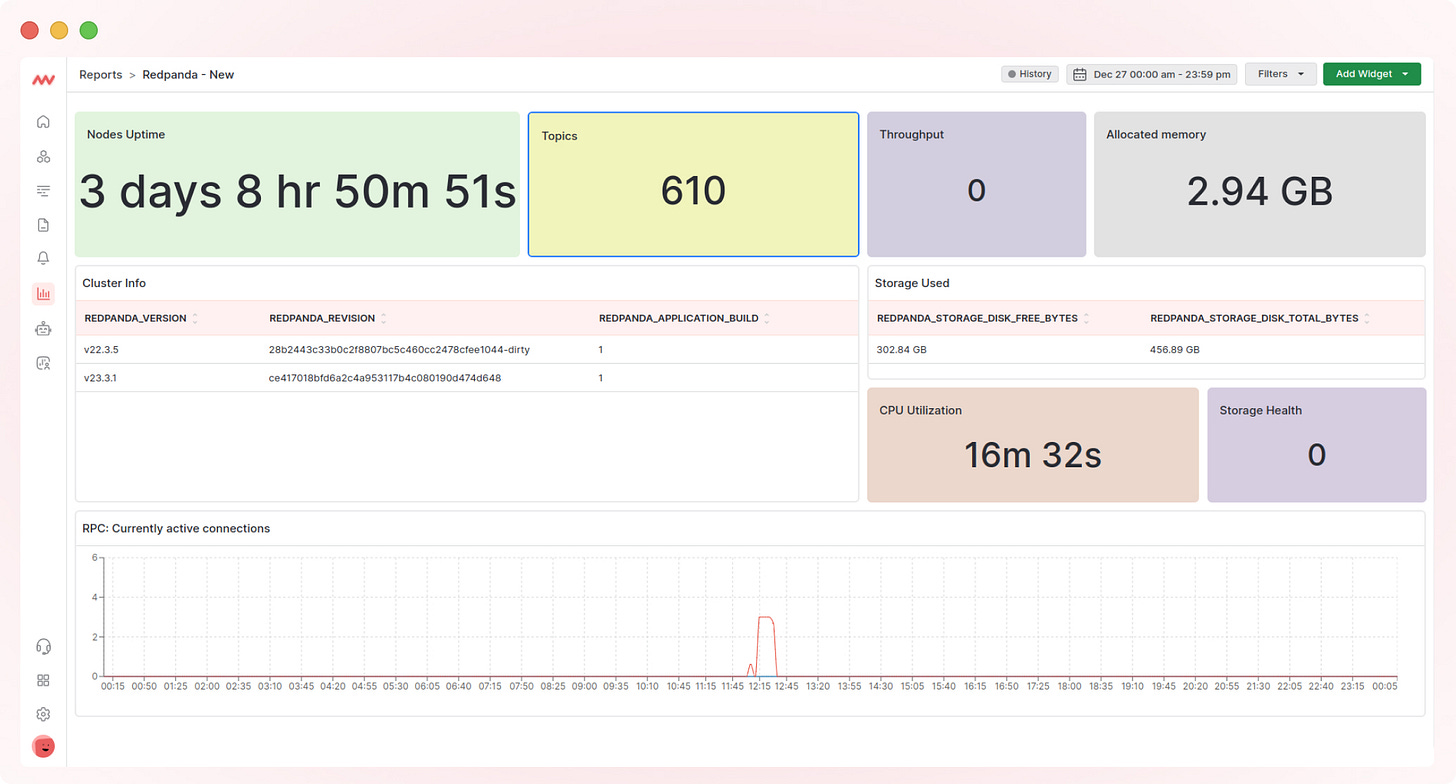
Monitor the key metrics and data pipeline of the RedPanda database, as well as its performance.
As with all integrations, below are the default metrics and more are available in our custom builder:
Health and Usage: Monitor resources of RedPanda cluster.
Raft Metrics: Monitor node status information.
Service Metrics: Understand the latency values with respect to threshold.
Partition Metrics: Check the offset values and custom logs performance.
Login today to get started.


