
Introducing Enhanced MongoDB Monitoring

We’ve rolled out new capabilities for MongoDB monitoring, including additional metrics and new dashboards that provide deeper visibility into database performance.
Easy Integration
Monitor MongoDB deployments across self-hosted environments (Linux and Kubernetes) as well as MongoDB Atlas with a simple setup process.
Performance Monitoring
Track and monitor key database metrics, including connections, operation load, query throughput, latency, locks and concurrency, index performance, query execution, memory utilization, TCMalloc allocator metrics, and network activity.
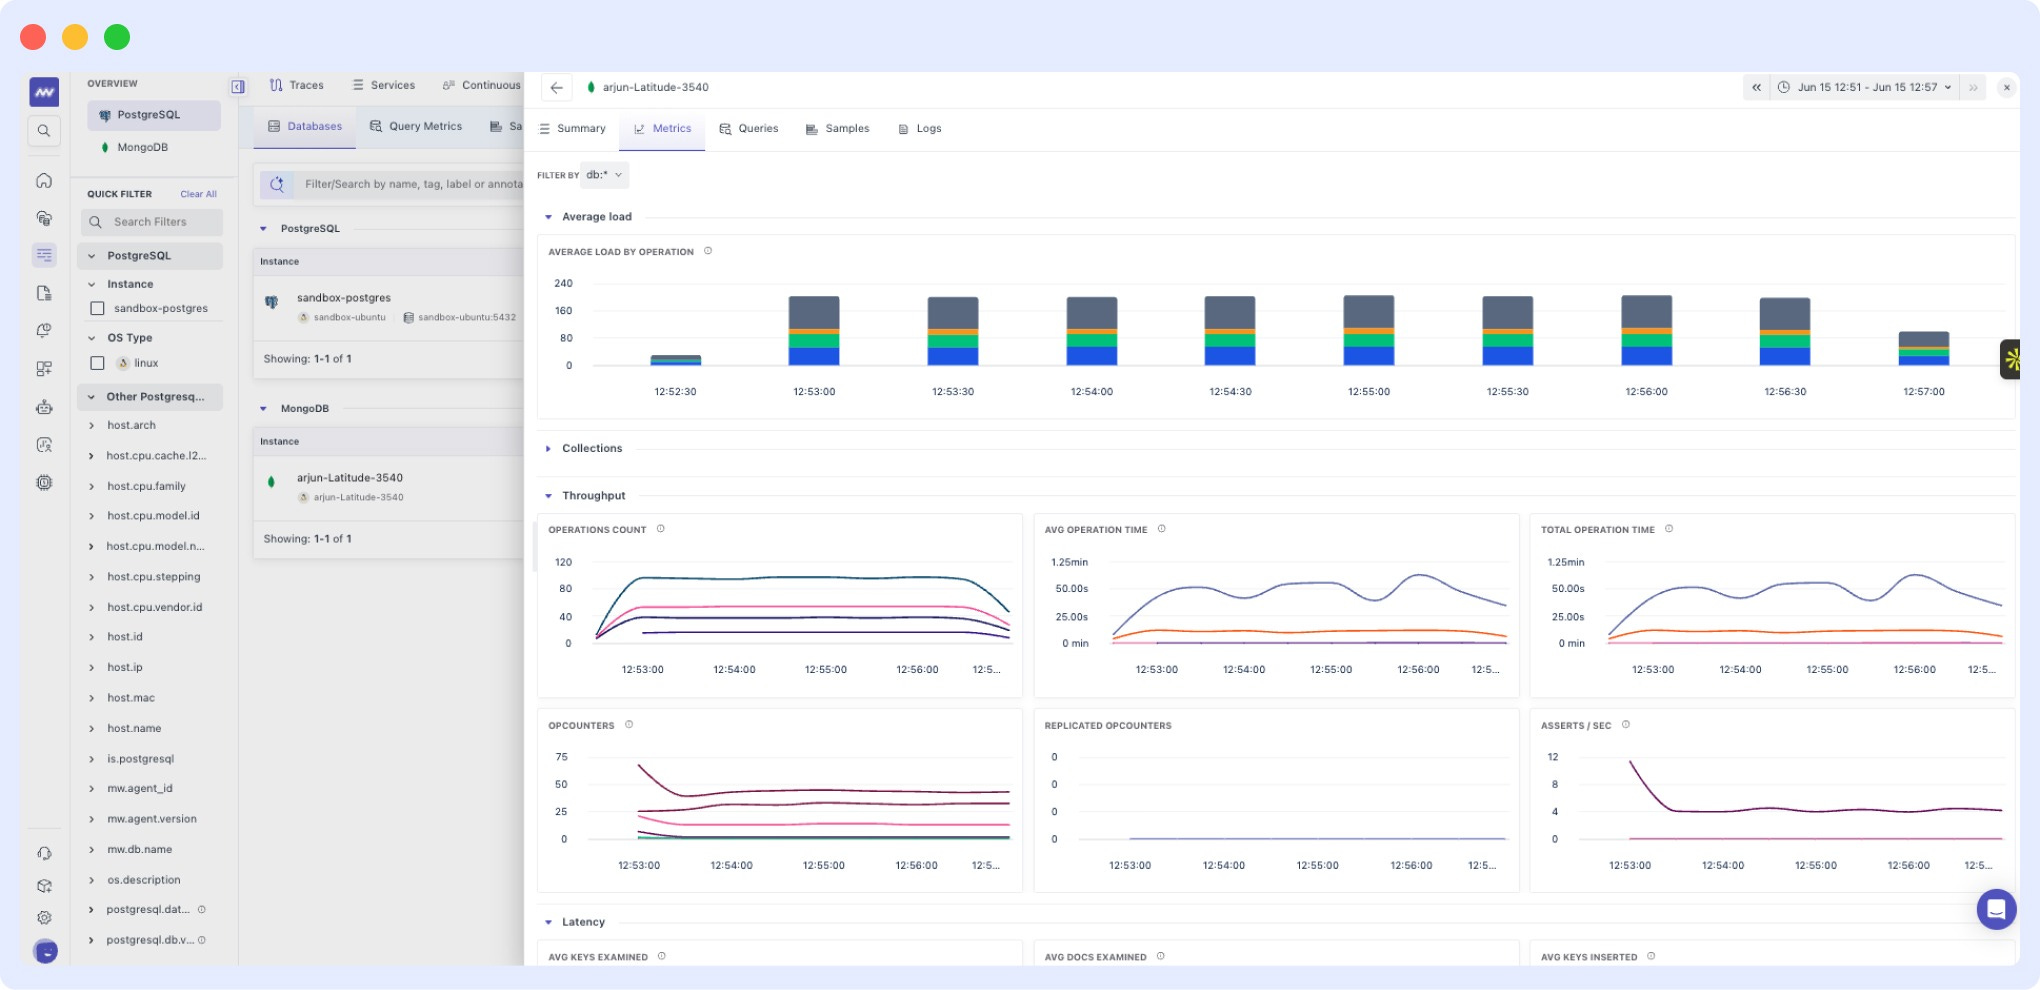
Collection insights
Monitor collection-level metrics such as data size, storage size, index count, and object count to identify growth trends, optimize performance, and prevent storage-related issues.
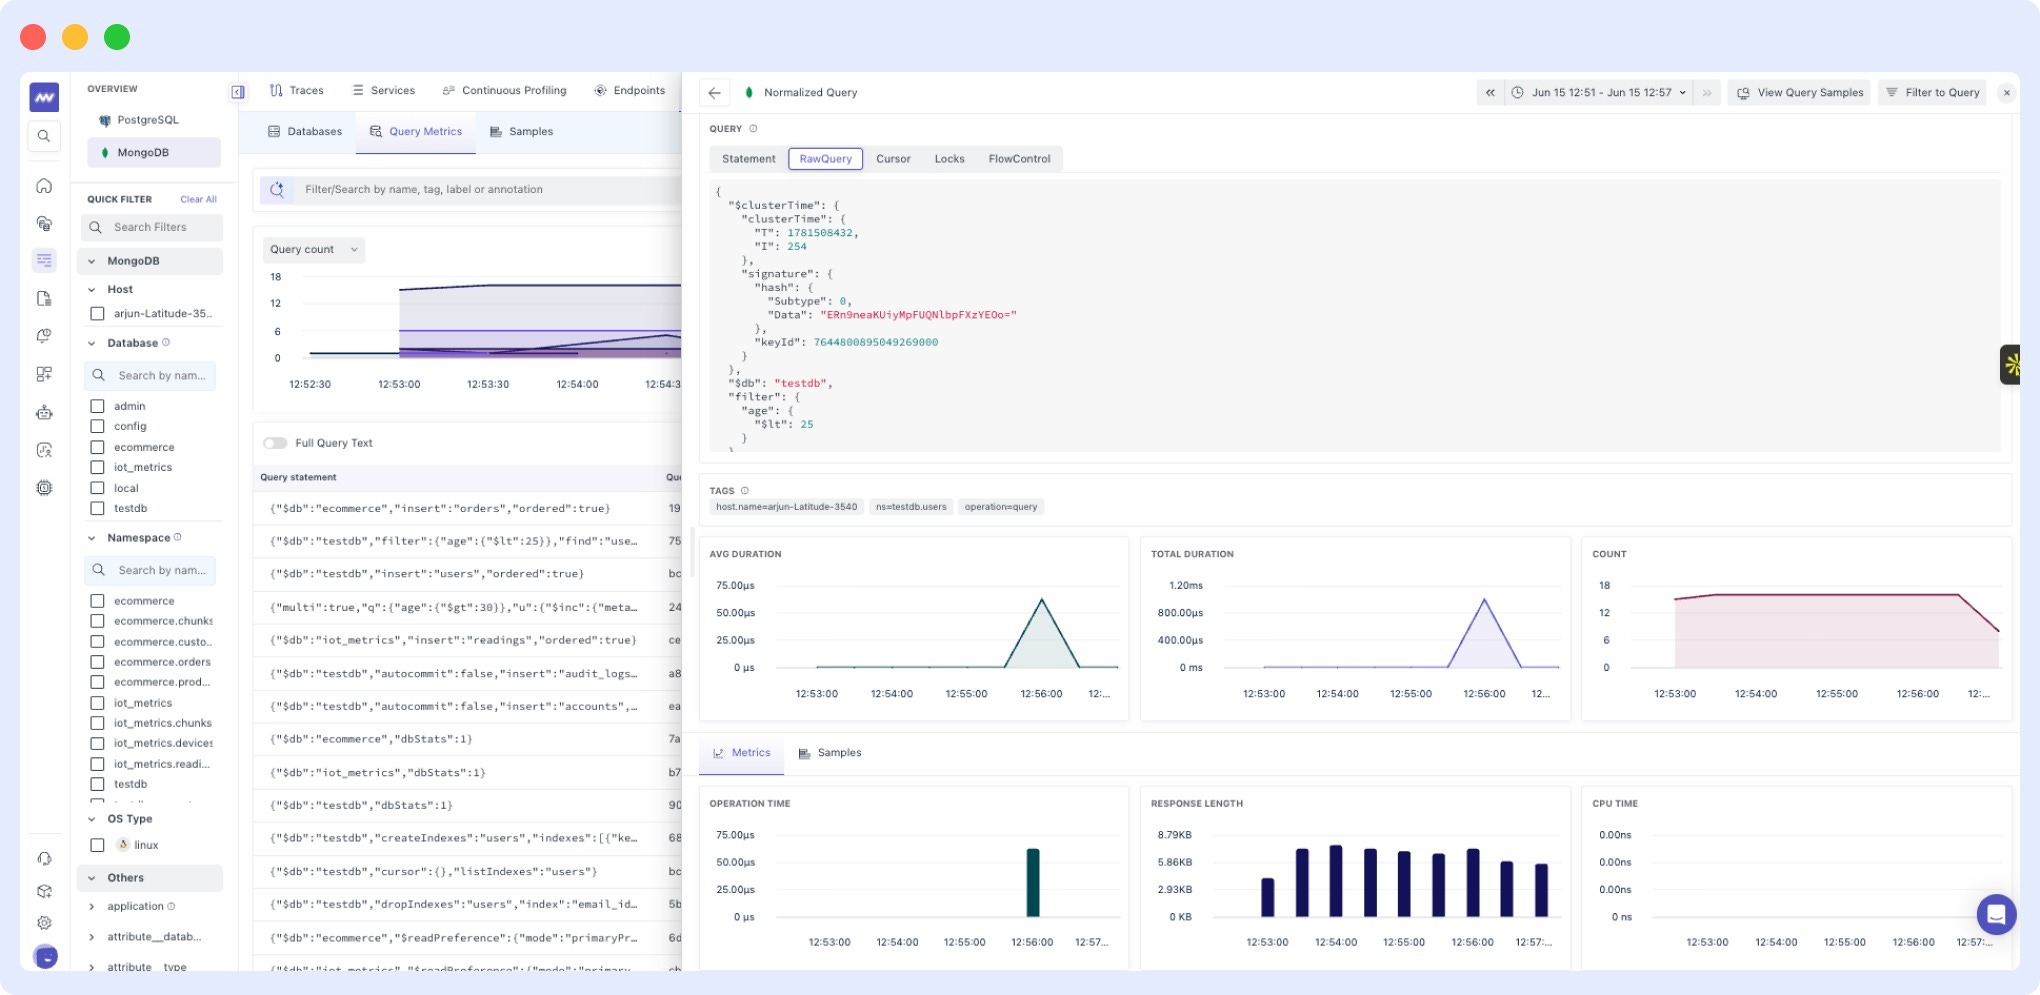
Query metric analytics
Gain visibility into query statements, raw queries, cursor activity, locks, and flow control to identify slow queries, reduce contention, and improve overall database performance.
I’d love to hear your thoughts on this release. Simply reply to this email, and I’ll get back to you as soon as possible.