Middleware Product Update for July 2023
Know more about new dashboards and other updates!
We’re constantly evolving based on customer feedback and are excited to share the progress we’ve made over the past month!
We have new dashboards that enable you to make deeper insights on your stack, expanded custom metric capabilities for deeper analysis on your logs, and continuous profiling for next.js. See below for more details.
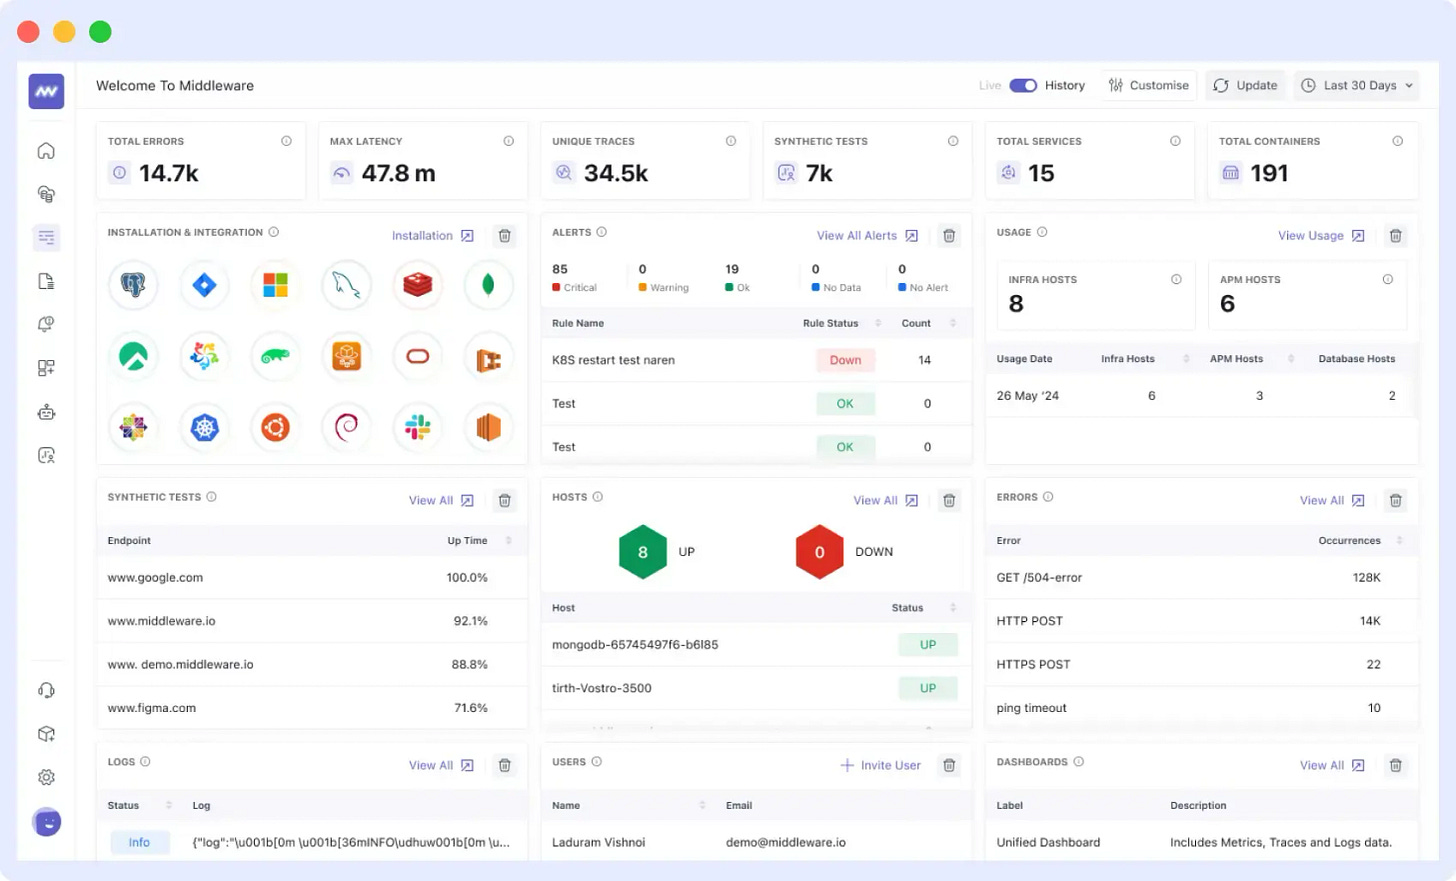
All-in-one Dashboard
With our new dashboard, you can easily see all your observability data for your entire tech stack in one dashboard. No more jumping between screens to get the insights you need.
This dashboard will be our default home dashboard which you will be directed to upon logging in. Our previous homepage dashboard - The Unified Dashboard - is still accessible through the Dashboard Builder screen.
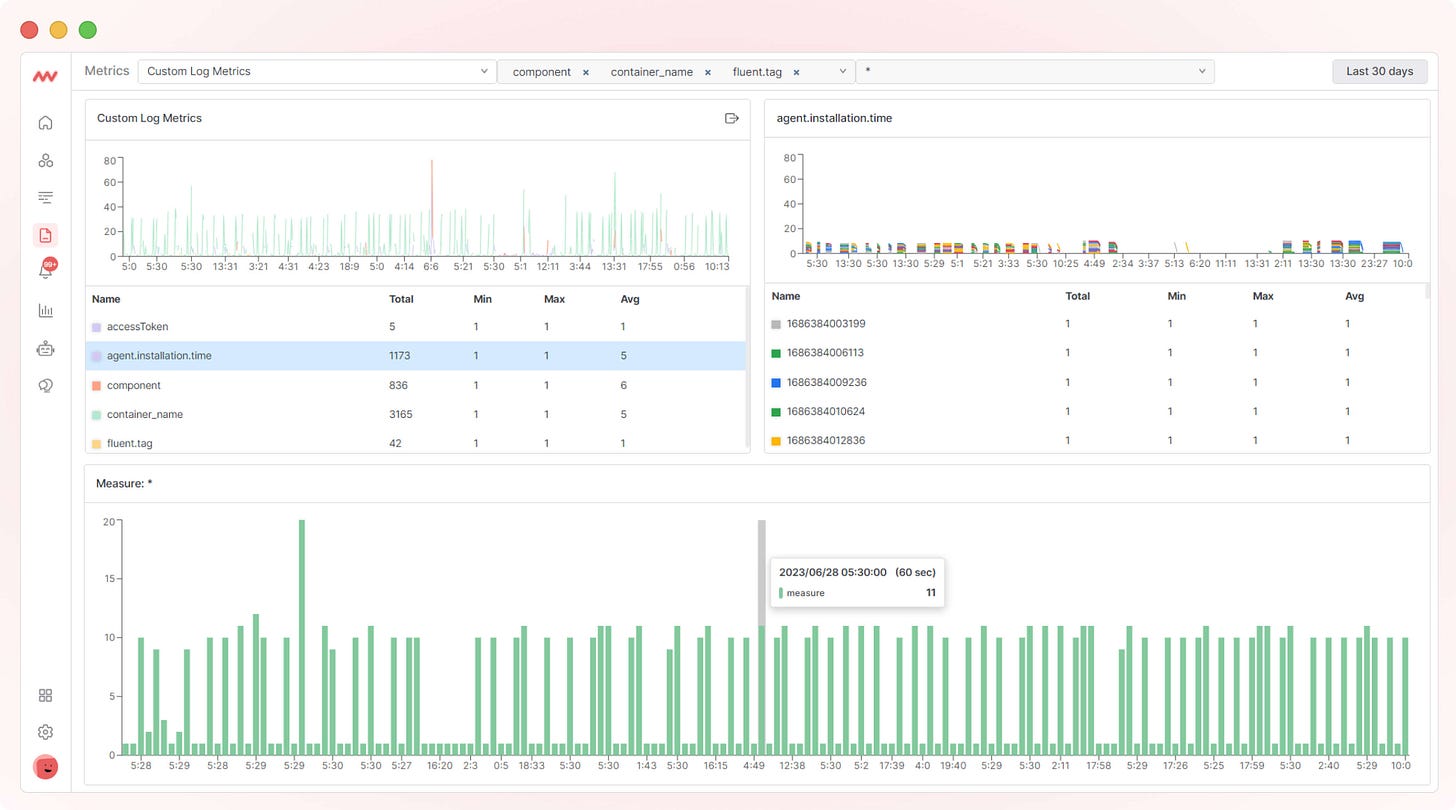
Custom metrics for Logs
You can now generate metrics for your logs. Custom metrics can help you gain deeper insights into your application’s behavior and performance by extracting meaningful information from your log data. Utilizing log-based metrics provides a cost-effective method for condensing log data obtained from the entire ingestion stream.
Read our detailed documentation to learn more about leveraging custom metrics for logs.
Dashboard for database monitoring
With our default dashboards, you can find all critical metrics for your databases (PostgreSQL and MongoDB) in one dashboard. Get started monitoring your database and improving performance with our quick and easy install.
Continuous Profiling
We now support continuous profiling for Next.js, which allows you to profile your service to visualize all your stack traces in one place. Using a heatmap style visualization you can now simply click through all traces pertaining to an event and its child events to expedite troubleshooting and diagnosis.
Stay tuned for more details, and feel free to reach out if you have any questions.


