Middleware Updates
Read about customization in log collection and other updates
Exciting updates are here!
We have improved log and data collection features, enhanced our K8s service, and made UX improvements for a better experience.
Application logs support in Java application
You can now access logs for Java-based applications directly on our unified dashboard and within the logs module.
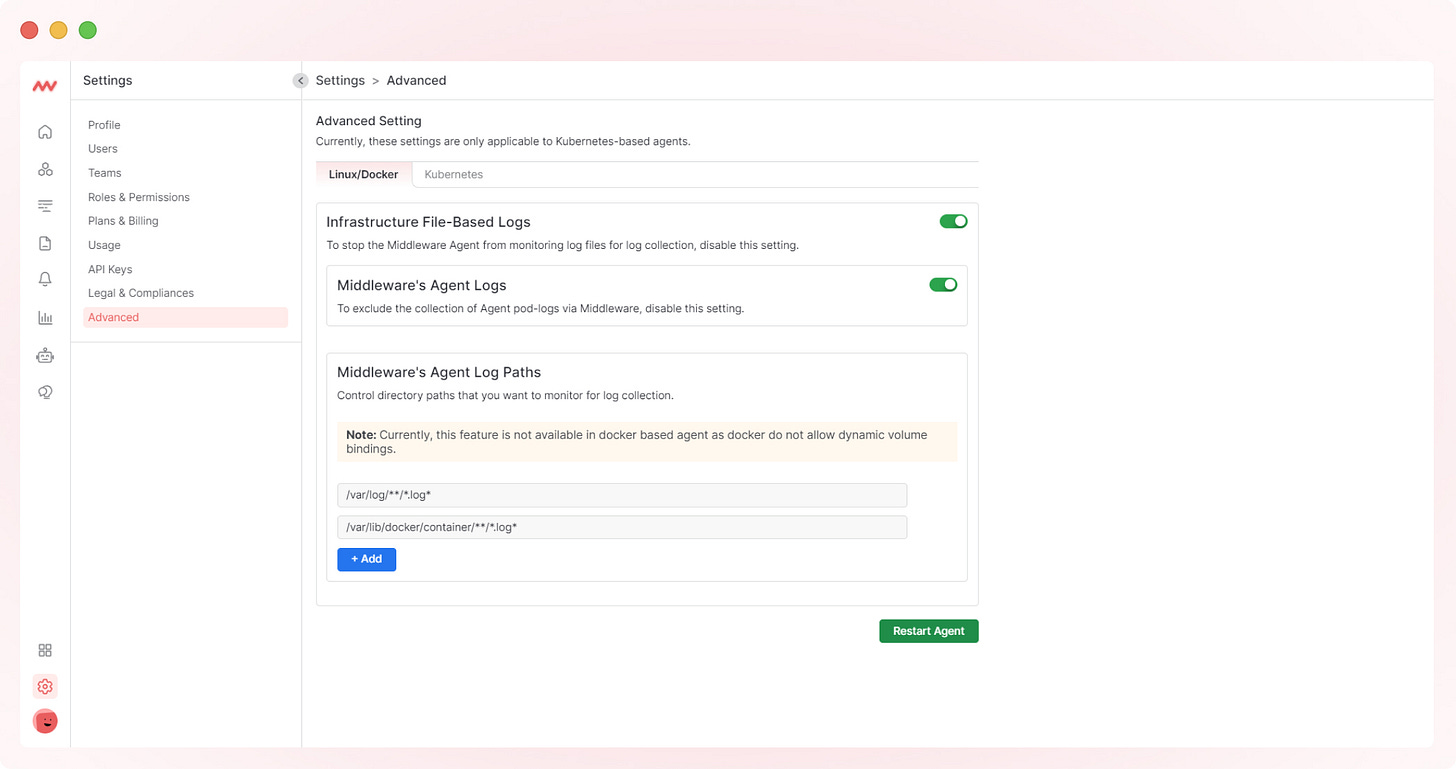
Advanced settings for log collection
To offer you more control, we have introduced advanced settings for log collection. You can now specify which logs to monitor and even define custom log paths.
Built a custom dashboard with K8s service data.
We have built a customized dashboard that allows you to list and monitor K8s services in real-time. By linking K8s pod and service data, you can also create informative graphs illustrating CPU, RAM, Disk, Network usage, and more.
UX updates
We have added a “save filter” option to save any filter and apply it with a single click to view log data.
Stay tuned for more details, and feel free to reach out at hello@middleware.io if you have any questions.


