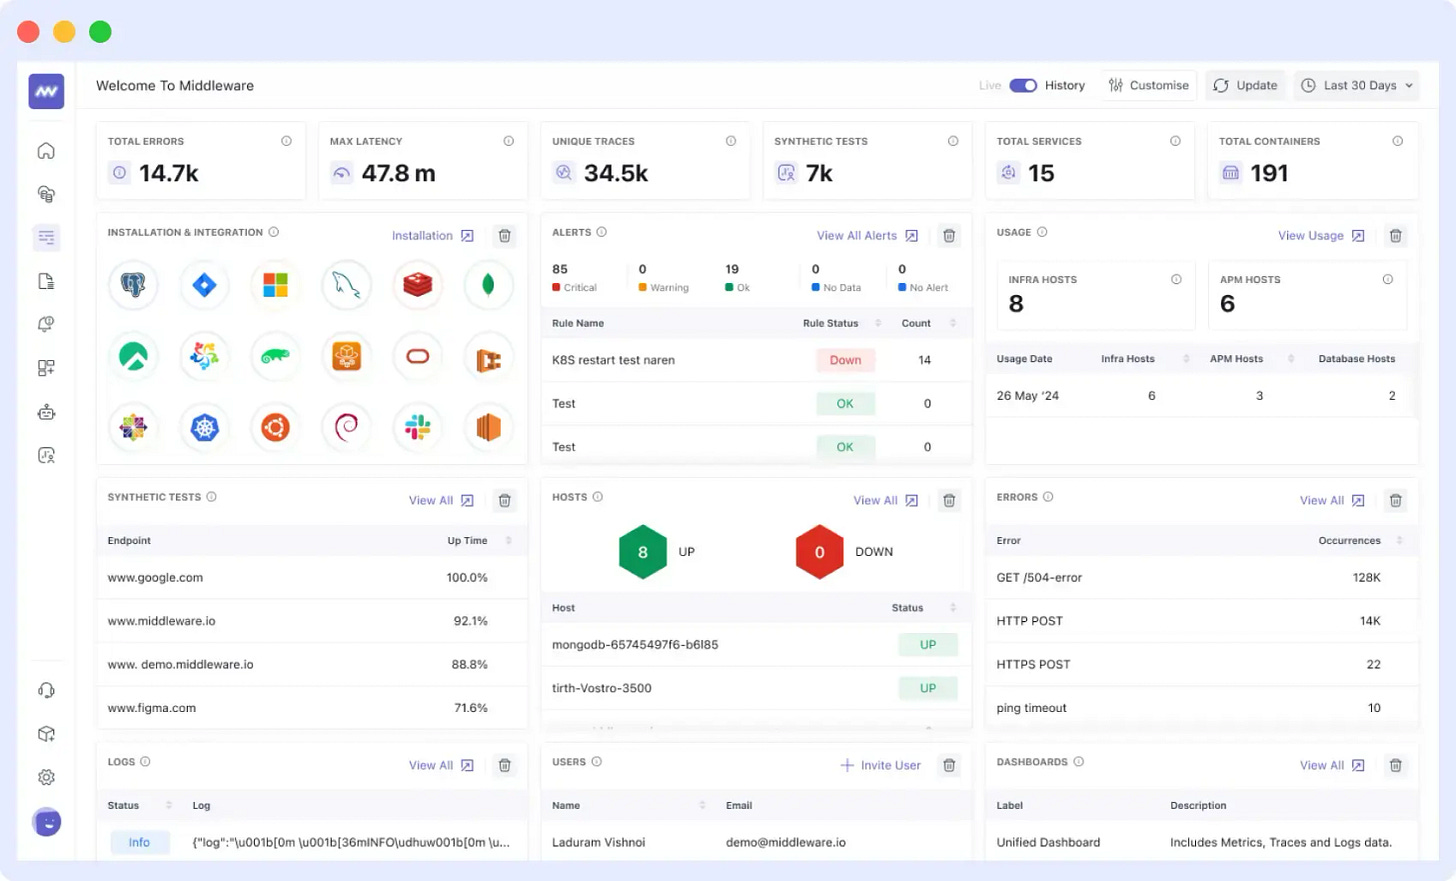
View all your observability data in one dashboard.
get overview of your entire tech stack in one dashboard!
We're excited to announce our latest update! Now, you can easily see all observability data of your entire tech stack in one convenient dashboard. No more jumping between modules for visibility – everything you need is now at your fingertips in a single view.
With our new dashboard, you can :
Access and analyze data from various sources, such as application logs, performance metrics, error rates, system health, user behavior, and more.
Accelerate the process of identifying errors and their root causes.
Visualize data in real-time to identify trends, spot anomalies, and respond promptly to potential issues.
Simplify monitoring and make informed decisions with data-driven insights.
Customize this dashboard and view the data that matters most to you.
With this update, this dashboard will be our default home dashboard which you can access right after login and The Unified Dashboard is accessible through the Dashboard Builder option.


